
Overview
ECMS is an international Global Supply Chain company that conducts cross-border deliveries with end-to-end solutions. The company features affordable shipping prices and developed market-relevant B2C and B2B capabilities through partnerships with some of the world’s leading eCommerce platforms. I led and built both the website and the customer/business portal.
My Scope as Only Designer
Work closely with founders and regional directors to build out digital products and drive marketing campaign for the US market.
Role
Sole Product Designer.
Tools
Figma . Matomo . Zoom . Teams
Timeline
Sep 2020- Sep 2021
Products
Consumer/business portal
Shipping website
Marketing assets
1.0 Consumer & Business Portals
53% reduction in support tickets
27% increase in business customer retention
I collaborated closely with engineers, directors, and the founder to strategically design and implement a scalable consumer and business portal. For consumers, the portal streamlined order tracking, bulk ordering, template reuse, and a rewards system—enhancing convenience and driving repeat engagement. On the business side, I optimized account management by enabling admins to invite team members, review and approve issues, and oversee order operations efficiently. This resulted in improved workflow automation, reduced friction in order management, and increased customer retention


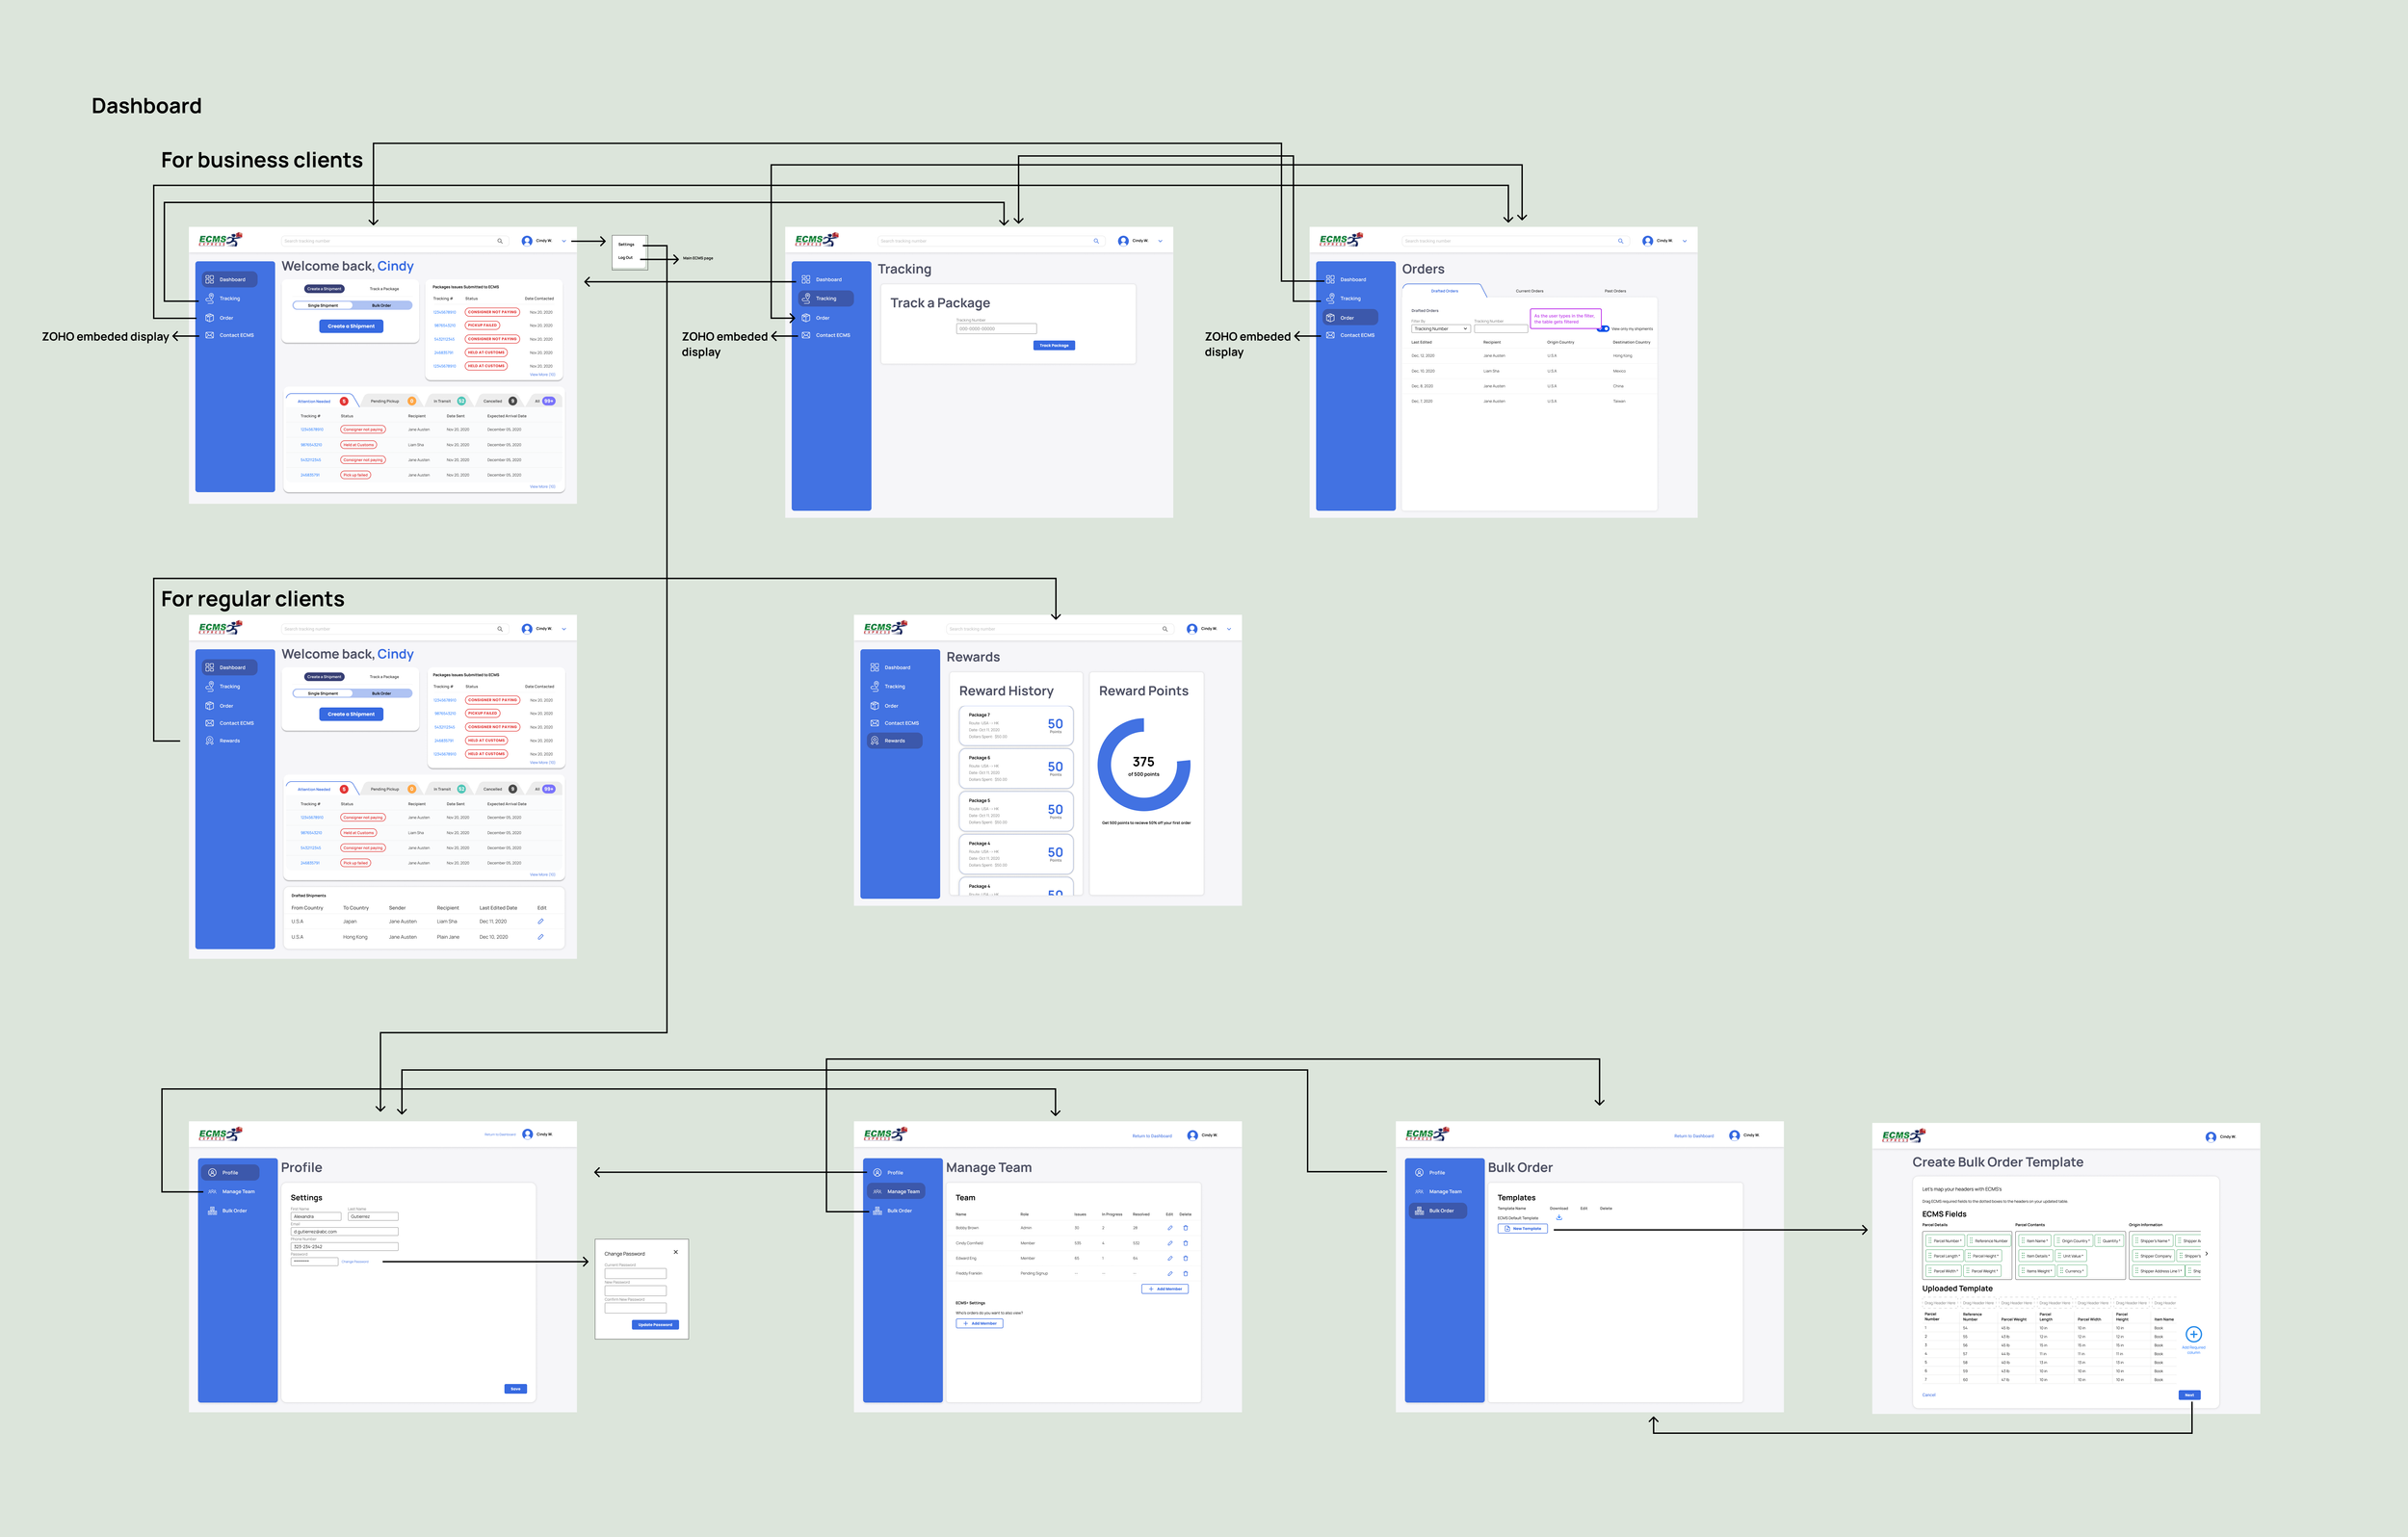
Business & Consumer in Portal Flows
1.0 Website Design Process

50% Increase in Revenue
The website enabled users to get a quote and create a shipment online as well as provide more business exposure.
I started by defining the website’s information architecture, collaborating closely with operations team members and data analysts who interact with customers and analyze user behavior. Their insights helped me identify key user personas, common actions, and pain points, allowing me to structure the site around intuitive user flows and seamless navigation.
User Types:
First-time individual shipper
Returning individual shipper (shipping or tracking)
First-time enterprise shipper
Returning enterprise shipper (shipping or tracking)
Key Interactions:
Ship a package
Track a package
Learn about the service
Contact us

Create a Shipment Flow

Design System from Ground Up
I built out a design system to ensure consistency and scalability across customer-facing products, which strengthens brand identity and improves the user experience. This leads to faster development, reduced costs, and better cross-team collaboration.

Marketing Asset Creation to Drive Campaign
Collaborate closely with the marketing team member to create and launch campaigns on various social media platforms.

Phase 2: Website Iteration to Increase User Conversion
The Problem
Following the launch of the 1.0 website, the landing page successfully attracted a good amount of traffic; however, the “Create a Shipment” conversion rate was disappointingly low.
The Goal
Identify and resolve the factors contributing to the low “ Create a Shipment” conversation rate.
Key Outcomes
6 Months after releasing the redesign, we achieved the following results:

💰 15% Increase in Shipment Revenue
📦 30% Increase in Create Shipment Conversion Rate
👥 63% More Traffic to Quote Page
Research
The Highest Bounce Rate Occurs On the Homepage.
To narrow down the cause of the low "Create a Shipment" conversion rate, I reviewed and analyzed the step-by-step shipment creation data funnel. I found out that the highest bounce rate of 58.80% occurs on the homepage.
This finding raised a crucial question:
Why are customers dropping out on the homepage before reaching the quote stage?
To pinpoint the cause, I conducted an in-depth analysis of the demography and homepage heat map. Based on the study, I identified two key observations:

demographic mapping
The 'Create a Shipment' feature is the most frequently used and aligns well with our business's desired user actions.
83.5% of the homepage customer traffic is coming from China and Japan.
71 .3% of shipping labels are created for shipments from the U.S to China.

Heat mapping
We have quantitative metrics; now it's time to gather qualitative data…
Since numbers alone don't tell the whole story, I decided to gather insights by conducting usability testing with a total 15 participants, 5 customers located in China, 5 located in Japan, and 5 located in other countries.
“ This is a lot of required information that I don't have at the preliminary stage of the shipping process. ” - Participant A
Scenario: You are looking to ship two pairs of shoes from the U.S. to China. Please show me how you would obtain a quote for your shipment.

Key findings
80% of Participants needed to outsource a US address to fill in the ‘From’ address
80% of Participants were unsure about the ‘Height’ , ‘Width’ , and ‘Length’ of the package
66.7% of Participants are not familiar with “Lb” and “ Inche” units
66.7% of Participants thought the CTA copy of ‘Create a Shipment’ was misleading
Solution- Effortlessly Obtain a Shipping Quote

Post Enhancement Designs
US Address Selections - provides warehouse addresses as references for international customers without a U.S. address to quickly obtain a shipping quote.

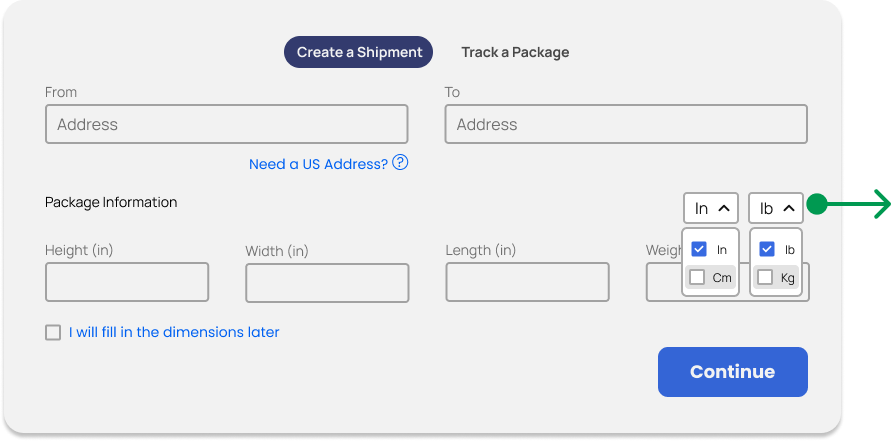
Unit Switching to Accommodate International Customers’ Behaviors - allows international customers to switch to units they are familiar with.
Fill in Dimensions Later - enables customers to obtain a quote range by entering only the weight, using predefined dimensions based on common shipping container sizes


Adjust CTA Copy to Avoid Disengagement of Inquiry Customer - change “create a shipment” to “continue” to set accurate expectations.

Reflection
Understanding user behavior through both quantitative and qualitative data is crucial for driving business success.
Quantitative data provides us with clear metrics and patterns of what users are doing, while qualitative data reveals the reasons behind their actions. This comprehensive approach enables us to make informed, user-centric decisions that enhance product design and user experience.
You might also like to view:

0-1 Mobile App & Desktop Portal - Surfacing the right feature at the right time.

E-Commerce Website — Rearranging information architecture and UI to accommodate the soft-launching

Mobile App — Streamlining customer journal entry flows to increase user engagement